Reports on Mailee
In order to get better at email marketing and check what’s working and what’s not, there is nothing better than looking at your reports and understanding them. Mailee.me offers detailed reports for each email campaign you send, so that you have more control over your email strategy.
To access the full overview of a message, all you have to do is click on it, either on your message list on Dashboard or by going to Messages.
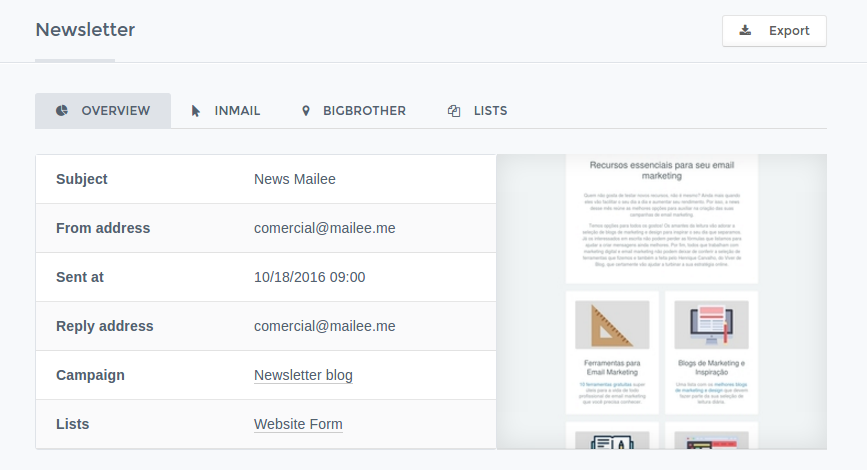
In the screen above you, can see the Overview of a report. Other tabs are InMail, BigBrother and Lists, all of which we’ll cover later.
Message statistics
In the Overview screen, you can also see the message statistics:
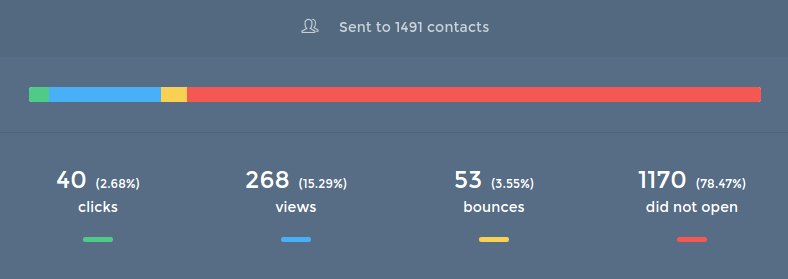
- Views - show the percentage of contacts that have opened your message (an access is only counted when the recipients click to show the images).
- Clicks - show the percentage of contacts that have opened your message and clicked on a link.
- Bounces - show the percentage of emails that have bounced, that means contacts that have not received your messages.
- Not opened - shows the percentage of contacts that have not opened your message.
Bounces
You’ll be able to see a graph with the main reasons why the emails have bounced. A bounce is when a contact has not received your message, this happens due to many reasons, most of them are related to an error with the email account.
You should always monitor your bounce reports and take preventive measures to keep this number low. High bounce numbers may indicate disrespect to Mailee.me's ANTISPAM policy.
Inside the Bounces box, you’ll be able to see the main reasons why these emails have bounced:
- Non-existent user - This email user does not exist, altough its domain exists.
- Unavailable Service - This means that our server has found the recipient’s server, but was not able to make contact with it.
- Temporary Error - There has been a temporary error that has prevented your email from being sent.
- Email rejeitado - The recipient server has rejected the receipt of this email. This can be related to anti-SPAM policies of this server.
- Quota - The recipient’s inbox was full.
- Unkwnown - It is not possible to identify the reason why the message was not delivered.
Unsubscribes
See the recipients of your message that have unsubscribed and why.
Forwards
See the contacts that have forwarded a message to their friends.
Tech
See the Operating System and email clients most used by your clients. This is a very useful piece of information, as it can help you better design your email campaigns according to your contact’s specific email clients.
Big Brother 2.0
Through Big Brother 2.0 report, you can follow the accesses to your messages in real time, including the geolocation of the contact.
InMail
View your message’s content and the highlighted links, with the number of clicks in each link.
Clicks in Links
It is possible to view how many contacts have clicked on each link of your message. In order to do that, click on the link you want to see in the Links box. To be even more clear, you can see the link, its text and the date and time of each click.
From then on, it is also possible to create a list with all the people who have clicked on a link in your message. You can create a new list with these contacts and/or include them in an already existing list. That is a great way of segmenting your contacts according to their interests!
Remember, the information regarding which contacts have clicked on the links will be updated with time, since many of the recipients might access your message some time after you send it. So, the ideal thing to do is to wait some days before creating those lists, to give time to all of your contacts to access this message.
Lists
Here you’ll be able to check the results of your message according to the lists you sent it to. You can see the lists that received the message and the number of views and clicks each list had. That way, you can see which list is giving you better results, and will be able to improve your sendings.
Exports
You can export the results of your messages to spreadsheets and control them. To export the sending results, you can click on Export in the Overview screen.
How do exports work?
When you export your contacts from Mailee, the generated files will not appear instantly. Actually, they are generated in a few seconds and will be available in your account’s Dashboard.
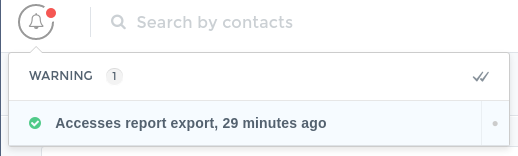
After clicking on Export, you will receive a message saying “We are working on your request, please check out your Dashboard later”. In a few seconds, you can click on the alert icon in your dashboard to view and download the file.
By doing this, we are able to provide you with more accurate files.
Campaign reports
Besides seeing your message’s statistcs, it is possible to view your campaign’s results as a whole. This is very useful to verify the performance of your campaigns through time, to see how changes in the messages, link content or subject line, have affected your results.
To see these reports, go to the Campaigns tab and click on the campaign you want to view. You’ll view a screen such as:
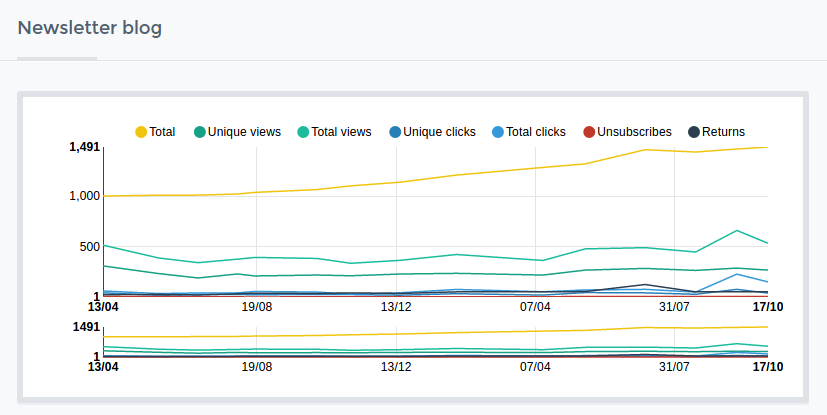
This graph gives you quick access to the following metrics:
- Total - All of your sendings
- Unique views - How many contacts have opened your messages
- Total Views - Total views, considering more than one open per contact.
- Unique clicks - Number of clicks, considering only one click per contact.
- Total Clicks - Total clicks, considering more than one click per contact.
- Unsubscribes - Number of contacts that have unsubscribed from your campaign.
- Bounces - Number of bounces (soft bounces and hard bounces).
Each line is a different metric. To take off a line from the graph, click the icon with the corresponding color on top.
Observing metrics through time
There are campaigns that go on for a long time and have a lot of messages (think of a weekly newsletter), and sometimes you need to take a closer look at these sendings over a period of time, to check changes and patterns. Don’t worry, in Mailee, this is very simple.
Below your campaign graph, you see the same graph, only smaller. This is the time selector.
Click on any point in the selector and drag your cursor. Done! Now, you can slide the beginning and the end cursor, selecting the time period in your campaign that you want to observe. It will appear automatically in the smaller graph.
In the campaigns report you can also see, in a table, all metrics of each message sent within this campaign. The metrics are the same as shown in the graph, so that you can compare the numbers easily.